Zomato Customer Analysis Segmentation

How I Used Data to Understand Zomato's Customers

Hey everyone!

So, it's been one year since I wrapped up a super interesting project analyzing Zomato's customer base, and I wanted to share how I dove into the data and what I found. If you don't know, Zomato is like the go-to app in India for anyone who loves food.

As a budding BI Analyst, this project was a fantastic opportunity to flex my analytical muscles and uncover some tasty insights. This was the first project that I had complete control over from planning to presentation. My mission was to figure out who Zomato's customers are, how we can group them, and what makes them order all that delicious food.

Data Dive - Not as Scary as it Sounds!

First things first, I had to get my hands dirty with the data. Luckily, the files weren’t huge, so I could use good ol’ spreadsheets to clean things up. Think of it as prepping your ingredients before cooking – essential, but not the main course.

Then came the fun part: segmentation analysis. This is where we start grouping customers based on what they do and who they are. It's like sorting people into Hogwarts Houses to understand them better.

What I Found (The Fun Part)

Here's a little sneak peek into what I discovered:

  • Zomato's crowd is on the younger side, mostly around 23 years old, and a lot of them are single guys.
  • There's a good mix of genders, but there are significantly more customers who are single than married.
  • Most customers have small family sizes (2-3), are educated, but here’s a twist – a lot of them are unemployed.
  • Those who are employed tend to be earning less.

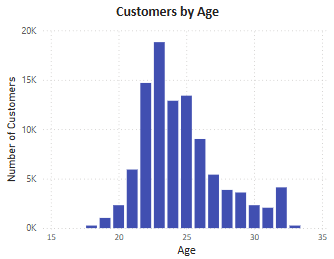
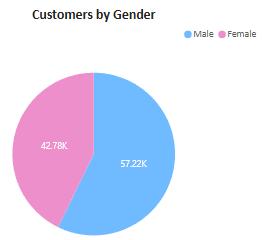
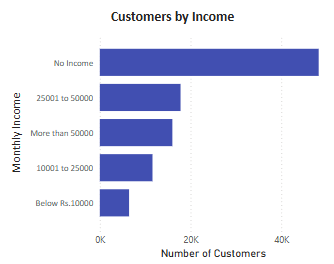
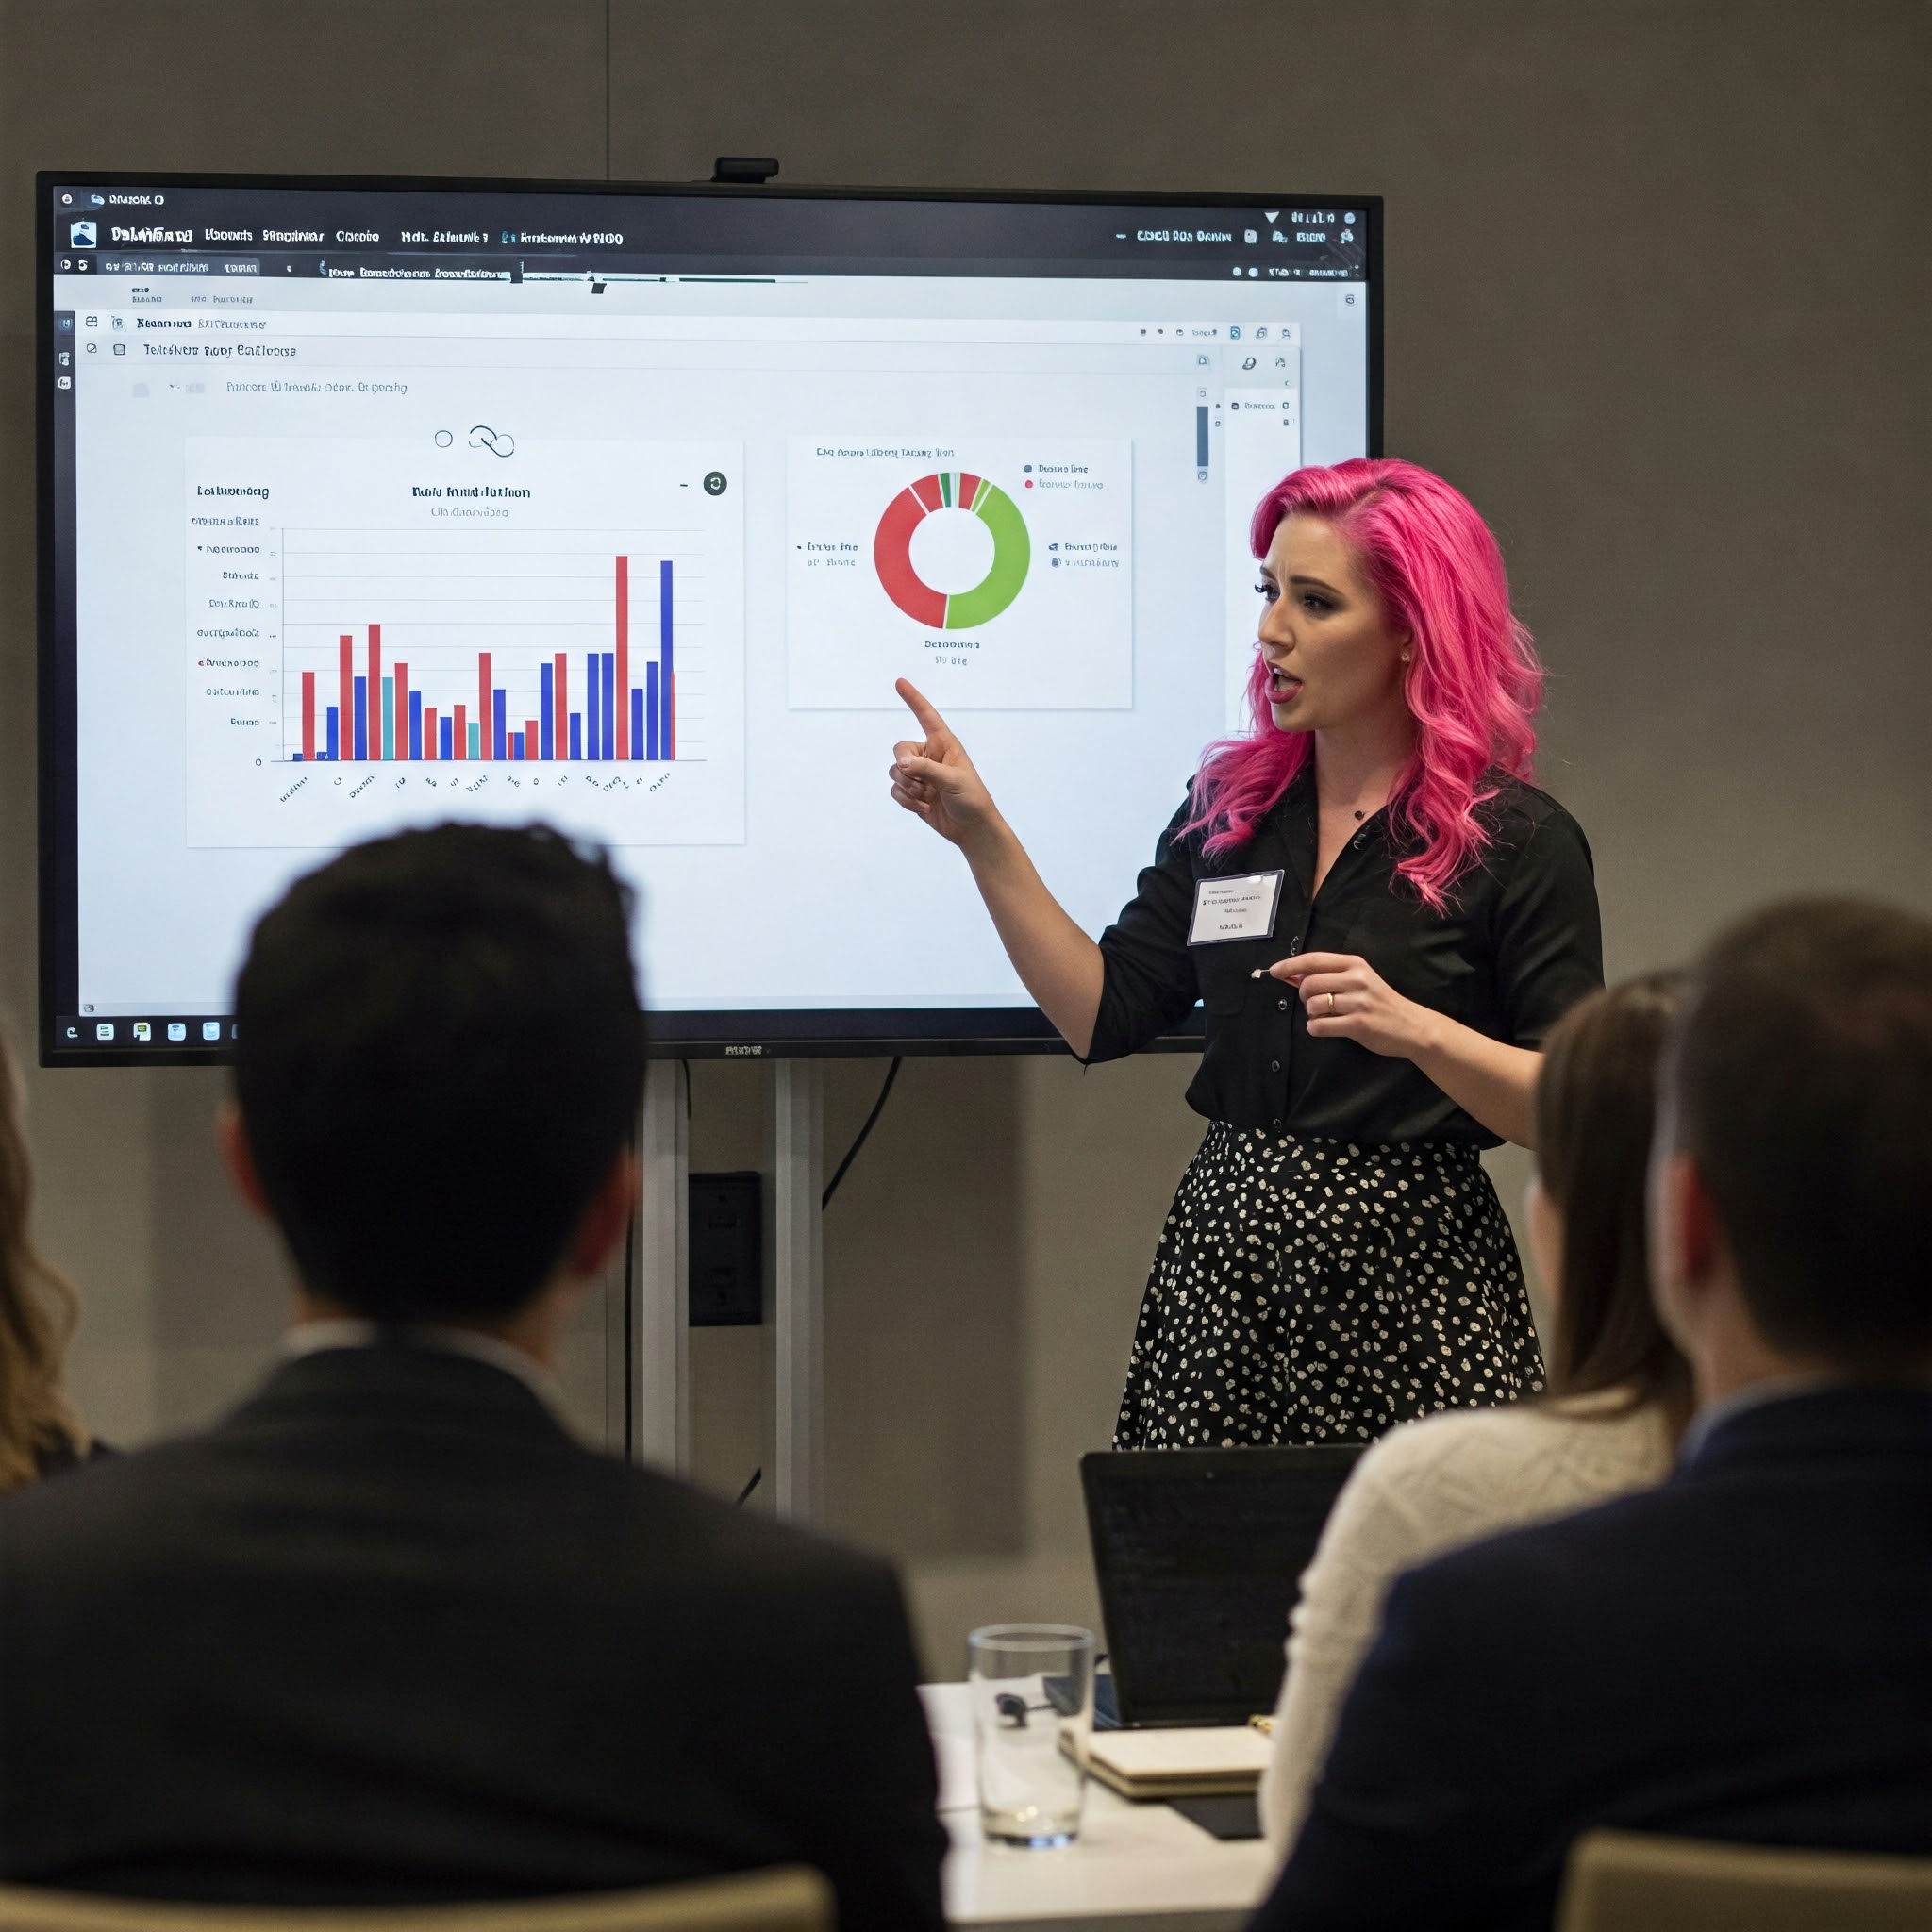
To visualize this, I created a dashboard with some cool charts and graphs. Because who doesn't love a good visual?

RFM Analysis - Or, How to Keep Customers Coming Back for More

I also used something called RFM analysis. It might sound technical, but it's actually pretty straightforward. It's all about:

  • Recency: How recently someone placed an order.
  • Frequency: How often they order.
  • Monetary: How much they spend.

By looking at these factors, we can segment customers even further and figure out the best ways to keep them engaged. It's like a restaurant knowing its regulars and what they love!

So What? (Why This Matters)

All this data is super useful for Zomato because it helps them:

  • Target their marketing: Instead of blasting everyone with the same ads, they can tailor their messages to different groups.
  • Boost sales: By understanding customer behavior, they can offer the right promotions to the right people.
  • Keep customers happy: This is the ultimate goal! By providing personalized experiences, Zomato can turn one-time buyers into loyal fans.

Why This Matters to You (Potential Employer or Future Coworker)

This project shows I can:

  • Take raw data and turn it into something meaningful: I'm not just about numbers; I'm about insights.
  • Communicate complex stuff in a way that anyone can understand: No jargon, just clear and concise info.
  • Provide actionable recommendations: I don't just identify problems; I offer solutions.

I'm excited to keep growing as a BI Analyst and tackle even more interesting challenges. As someone who tutors BI Analyst skills at TripleTen, I am continuously honing these skills. If you're looking for someone who's passionate about data and eager to learn, let's chat!

Want to Learn More?

If you’re curious about TripleTen or data analysis, I’ve got a link that will lead you to a recruiter for further information and a DISCOUNT!

TripleTen: An online coding bootcamp that enables people with busy lives to make the transition into tech. My Discount Link

I hope this gives you a fun and insightful peek into my data adventure!

Shopify App

Uncovering the Secrets to e-Commerce Platforms

Diving Deep into the Shopify App Store 🕵️‍♀️📊

In today's digital age, e-commerce platforms like Shopify have revolutionized how businesses operate. But with thousands of apps available in the Shopify App Store, how can developers ensure their app stands out and achieves success? 🤔 That's the question I tackled in my latest project for the TripleTen Business Intelligence Analytics Program.

My Mission: Uncover the Keys to App Store Success 🔑

This project challenged me to analyze data scraped from the Shopify App Store to understand the app landscape and identify the factors that contribute to an app's popularity and positive reception. I utilized my Power BI skills to transform raw data into interactive dashboards and visualizations, revealing key insights.

Data Wrangling and Exploration 🧹

The project began with a raw Excel file containing information about various aspects of Shopify apps, including app details, categories, and user reviews. My first step was to familiarize myself with the data, clean any inconsistencies, and prepare it for analysis in Power BI. This involved joining different tables and ensuring data accuracy.

Visualizing the App Landscape 📊

With the data prepped, I harnessed the power of Power BI to create interactive dashboards. I focused on three key areas:

  1. App Store Landscape: I used KPI cards and charts to visualize the overall distribution of apps, their categories, and their ratings. This provided a comprehensive overview of the app marketplace.
  2. Review Analysis: I delved into the review data, using visualizations to understand user sentiment, identify trends in feedback, and analyze the impact of developer responses on app ratings.
  3. Developer Performance: I analyzed app developers based on various metrics, such as average ratings, number of reviews, and responsiveness to user feedback. This allowed me to identify top-performing developers and understand their strategies.

Key Findings 🗝️

My analysis revealed several interesting insights:

  • New apps tend to receive more ratings early on, suggesting the importance of initial impressions.
  • Most apps are rated favorably, indicating a generally positive user experience in the Shopify App Store.
  • Developer responsiveness significantly impacts app ratings, with higher ratings for apps where developers actively engage with user reviews.
  • Reviews marked as helpful by other users tend to have higher ratings, highlighting the importance of community feedback.

Insights for App Developers 💡

Based on my findings, I was able to provide valuable recommendations for Shopify app developers:

  • Prioritize early engagement with users to gather initial feedback and build a positive reputation.
  • Actively respond to user reviews, demonstrating a commitment to customer satisfaction and continuous improvement.
  • Focus on creating high-quality apps that address user needs and provide a positive experience.
  • Encourage users to provide feedback and mark reviews as helpful to build community trust.

This project was a fantastic opportunity to apply my Power BI skills to a real-world dataset and gain insights into the dynamics of the Shopify App Store. By transforming raw data into compelling visualizations, I was able to uncover valuable insights and provide actionable recommendations for app developers.

Want to Learn More?

If you’re curious about Power BI or data analysis, I’ve got some resources for you:

I hope this gives you a fun and insightful peek into my data adventure!


February 2024

Zomato

Customer Analysis Segmentation

A Customer Analysis Segmentation with RFM for Zomato restaurants via Power BI.

Power BI Dashboarding Market Analysis Reporting

January 2024

Shopify App

Platform Analysis

A review of the landscape on the Shopify platform identifying KPIs that contribute to its success via Power BI.

Power BI Data Visualization Reporting Stakeholder Presentation