Reworking the Manhattan Airbnb Analysis 🏙️

From First Draft to Final Deliverable

A Story of Growth

Sometimes, the most valuable projects are the ones you do twice. Let me be brutally honest: when I first analyzed the Manhattan Airbnb market back in 2023, it was my very first spreadsheet analysis. I was brand new to the field, and I was simply going through the instructed motions. Trying my best to put together skills I recently learned. Little did I know at the time, but that is a skill in itself!

After graduating from my bootcamp in 2024, I looked back at that initial project and had a blunt realization—it sucked. The basics were there, but it wasn't a polished, professional deliverable ready for a CEO. So, I decided to rework it from the ground up. I wanted to go beyond just following steps and perform a deeper dive, turning it into a strategic guide that could truly help an investor break into one of the world's toughest markets.

A messy, unorganized spreadsheet representing initial data analysis challenges.

The challenge remained the same: advise a new-to-the-scene client on what type of vacation rental to invest in, using public Airbnb data as our guide. This time, however, I approached it with a completely new perspective.

Finding the Sweet Spot

My mission was to create a data-backed investment profile. I focused my analysis on short-term rentals only and looked for the "sweet spot" by focusing on a few key metrics:

  • Popularity: I used the number of reviews in the last 12 months as my primary proxy for popularity.
  • Property Profile: I analyzed which neighborhoods and what number of bedrooms were most in-demand.
  • Revenue Potential: I calculated an estimated annual revenue based on the characteristics of top-performing listings.
  • Deeper Factors: I also dug into secondary factors, like whether having a doorman or offering instant booking really made a difference.
A clean, professional data dashboard showing key Airbnb market insights for Manhattan.

The Manhattan Investment Blueprint

The data painted a surprisingly clear picture of what success looks like in the Manhattan Airbnb market. This should be transferrable to any other short term vacation rentals in the area.

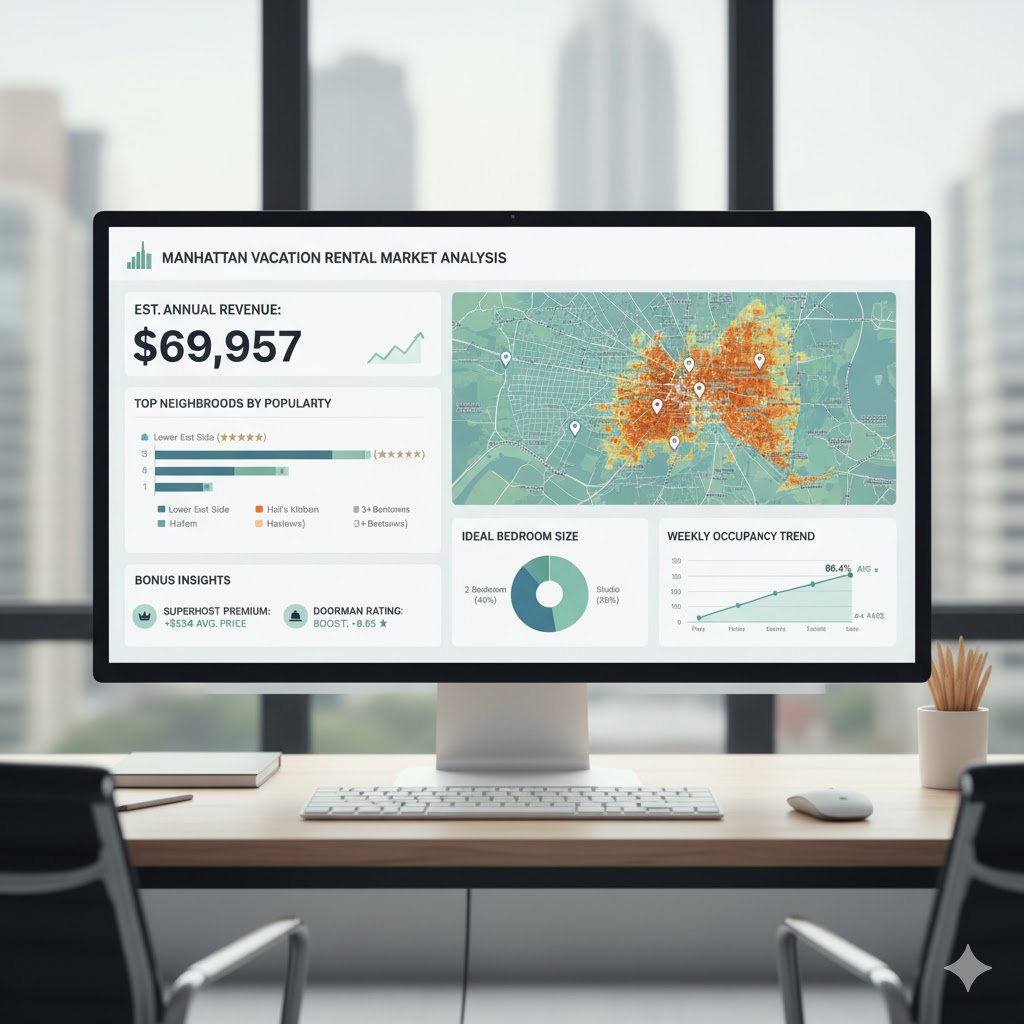
The top recommendation was clear: invest in a one-bedroom property in the Lower East Side. However, the data also showed that the "perfect" property isn't one-size-fits-all across the island. For instance, while one-bedroom units are the overall winner, renters in Hell's Kitchen prefer two-bedroom properties, and in Midtown, studios are king.

Here are some of the key takeaways I presented to the client:

  • Top Neighborhoods: The most popular neighborhoods included the Lower East Side, Hell's Kitchen, Harlem, and Midtown.
  • The Money Maker: Following the ideal property profile could yield an estimated annual revenue of $69,957.
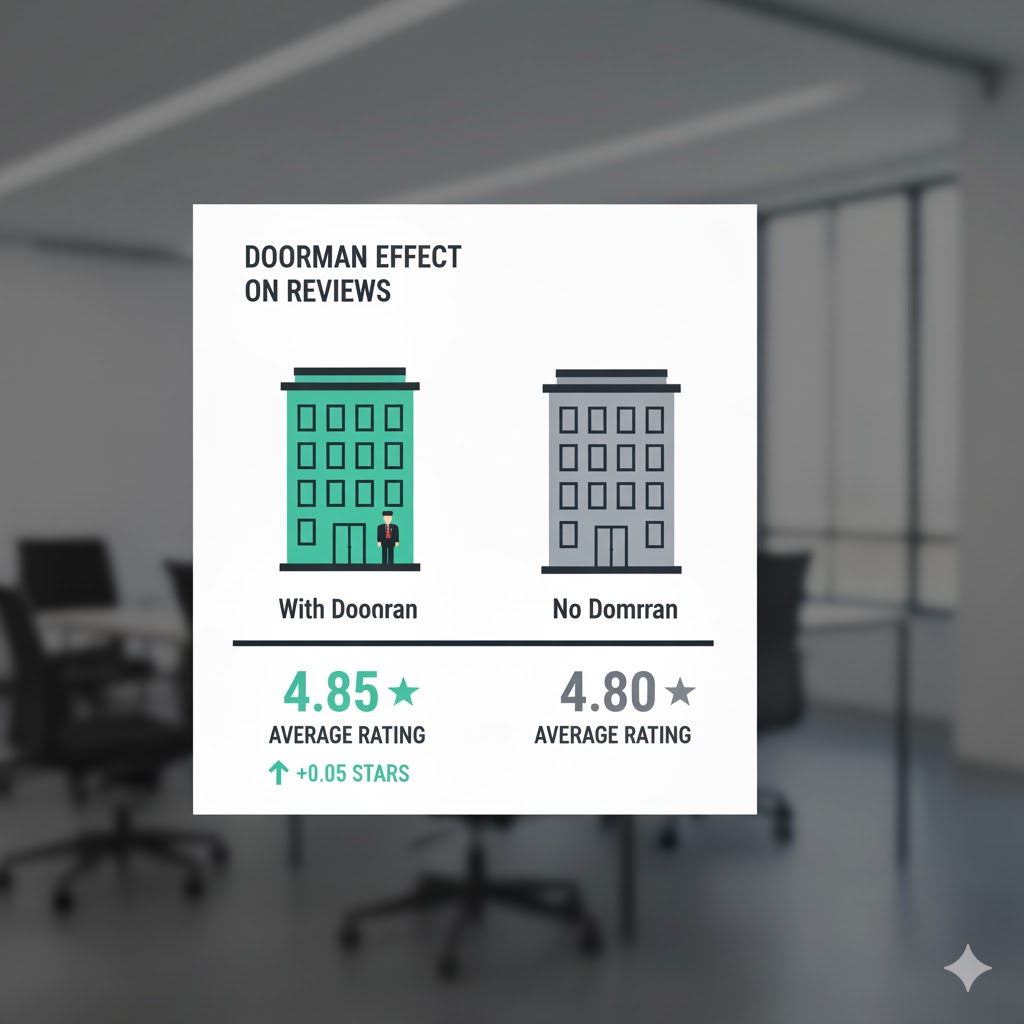
  • Bonus Insights: Little things make a big difference! Properties with doormen get slightly better reviews, and Superhosts can charge significantly higher prices (an average of $334/night).
A comparison graphic showing how doormen or Superhost status impacts rental reviews or pricing.

What I find most interesting is that I don't personally know these neighborhoods like a local. My recommendations weren't based on gut feelings; they were driven 100% by the data. It’s a perfect example of how business intelligence provides a clear, unbiased path forward, even in an unfamiliar landscape.


Want to see the data?

You can explore the full analysis in the Google Sheet at the GitHub link below!

View Project on GitHub

Want to Learn More?

If you’re curious about market analysis, I’ve got a resource for you:

  • TripleTen: An online coding bootcamp that enables people with busy lives to make the transition into tech. My Discount Link

Fresh Beats Music Streaming

A Fresh Reflection on My BI Beat

The Project That Taught Me the Ropes 🎶

Looking back on your career journey, some projects stand out not just for the work you did, but for what they taught you. For me, the "Fresh Beats" project from 2024 was exactly that—a critical step in my journey from a beginner with basic spreadsheet skills to a full-fledged analyst.

When I first started, my world was basic Excel and Word. I was just getting my feet wet, learning the fundamentals of business acumen and how to read the stories hidden in pivot tables and charts. Then came the "Fresh Beats" project, my first real taste of the professional BI workflow. I was given analytical work completed by senior team members and tasked with one thing: turn it into a clear, actionable report.

A Cog in the Machine (And Why It Mattered)

At that moment, I was a cog in the machine—a vital one, but still a single part. My job was to be the translator, taking the technical findings from the analysis and crafting them into a business-friendly narrative that leadership could act on. It was my first time truly understanding the flow of a BI team: how raw data becomes analysis, and how analysis becomes strategy.

A single gear fitting into a complex machine.

My deep dive into their work led to one key recommendation: Fresh Beats needed to capitalize on new music trends by running targeted marketing campaigns for the Electronic and Hip-Hop genres. This was the tangible outcome, the "what."

The Full Circle: From a Single Step to End-to-End

But the real lesson was the "how." That project was foundational. While my role then was to handle one crucial step, it gave me the blueprint for the entire process. It’s the difference between knowing how to build one part of an engine and knowing how to design and build the whole car.

Today, I’m no longer just a cog. That experience and everything I’ve learned since has empowered me to manage the entire end-to-end process myself, from the initial data query to the final strategic presentation. It was an essential milestone that built the confidence and competence I bring to my work now.

Image of clockmaker

Want to see the report?

You can explore the project repository on GitHub or view the final PDF report directly.

View Project on GitHub View Final Report (PDF)

Want to Learn More?

If you’re curious about business analysis, I’ve got a resource for you:

  • TripleTen: An online coding bootcamp that enables people with busy lives to make the transition into tech. My Discount Link

An E-Commerce Company

A Business Analysis: Funnels & Cohorts

Cracking the E-Commerce Code: My Adventure in Data Decoding

Ever wonder what goes on behind the scenes at your favorite online stores? How do they know what you like, what you might buy next, and why you sometimes abandon your shopping cart at the last minute (we've all been there!)? Well, in my latest project for the TripleTen Business Intelligence Analytics program, I got to play detective and uncover these secrets using the power of data analysis!

This wasn't just any project—it was a deep dive into the world of e-commerce, where I transformed raw website activity logs into juicy business insights. Think of it as turning a jumbled mess of puzzle pieces into a clear picture of customer behavior.

From Data Jungle to Data Playground

Imagine a massive spreadsheet filled with every click, every view, and every purchase on an e-commerce website. That was my starting point—a data jungle! My first task was to tame this wilderness, filtering, cleaning, and organizing the data into something usable. It was like going on a data safari, clearing paths and labeling everything along the way.

Building the Customer Journey: Funnels and Repeat Customers

With the data tamed, I built two key tools to understand the customer journey:

  • The Conversion Funnel - The Buyer's Adventure: This funnel tracks the steps a customer takes from discovering a product to actually buying it. It's like following a breadcrumb trail! My analysis revealed a bit of a bottleneck: while many people added items to their carts (a respectable 29% conversion rate), only 10% actually completed the purchase. This was a big "aha!" moment, suggesting there might be issues with the checkout process or product pages that need fixing. Maybe the shipping costs were a surprise, or the checkout process was too complicated. Time to investigate!
  • Retention Rates - Will They Be Back?: This metric tells you how many customers become repeat buyers. I focused on a cohort of customers who made their first purchase in September 2020. The results? Not so great. After just one month, only 13% were still buying, and by month four, it was down to a measly 3%. Ouch! This clearly showed a need for strategies to keep customers coming back for more.

My Data-Driven Detective Work: Recommendations for Success

Based on my data sleuthing, I presented the e-commerce company with some key recommendations:

  • Conquer Cart Abandonment: Those abandoned carts are like lost treasure! By figuring out why people are leaving without buying, the company can make changes to the checkout process and win back those potential sales.
  • Woo Repeat Customers: Happy customers come back for more! Strategies like personalized emails, loyalty programs, and top-notch customer support can turn one-time buyers into loyal fans.
  • Ask the Customers!: Sometimes, the best way to find out what's wrong is to just ask! Gathering customer feedback through surveys or reviews can provide invaluable insights.
  • Keep Analyzing!: Data analysis is an ongoing adventure. Regularly checking the data keeps the company on track and helps it spot new opportunities and challenges.

This project was a blast! I got to use my business intelligence skills to turn raw data into a compelling story and provide real, actionable advice for a business. It's like being a data superhero, using numbers to save the day!

Want to see the evidence?

You can check out a PDF with screenshots of all my work PDF HERE

Want to Learn More?

If you’re curious about business analysis, I’ve got a resource for you:

  • TripleTen: An online coding bootcamp that enables people with busy lives to make the transition into tech. My Discount Link

I hope this gives you a fun and insightful peek into my data adventure!

The Zuber Database

Using SQL to Analyze Taxi Rides in Chicago

My SQL Adventure with the Zuber Database:

Ever wondered what makes a taxi driver's day? Is it a sunny Saturday or a rainy Tuesday? Which company reigns supreme in the Windy City? As part of my Business Intelligence Analytics training with TripleTen, I dove headfirst into a project that aimed to answer these very questions, using the magical powers of SQL!

Think of SQL as the secret language you use to chat with databases. It's how you ask them questions and get them to spill their secrets. In this case, our database was a treasure trove of Chicago taxi ride data – think of it as a digital diary of every trip, from pickup to drop-off.

Why did I embark on this data quest?

Imagine you're running a ride-sharing app. Wouldn't it be awesome to know what customers want, what affects their travel plans, and how your competitors are doing? That's exactly what this project was about! By digging into the data, we could uncover hidden patterns and trends that could help companies like Uber or Lyft make smarter decisions.

My Mission:

  • Part 1: The Great Taxi Census: I used SQL to count taxi rides for different companies during specific periods. It was like conducting a census, but for taxis! I wanted to know who was the most popular kid on the block. By grouping and sorting the data, I could easily see which companies were racking up the rides. It was a bit like a taxi popularity contest!
  • Part 2: Loop to O'Hare - The Weather Challenge: This part was all about figuring out if Mother Nature had a say in how long it took to get from the Loop to O'Hare. I played detective, finding the neighborhood IDs for these locations and then checking the weather records for each hour. I even created a simple weather rating system: "Good" for no rain or storms and "Bad" for those less-than-ideal conditions. Then, I pulled up all the Saturday rides between these two points, noting the weather and the ride duration. This allowed me to see if a rainy Saturday meant a longer trip to the airport.

The Tools of the Trade (aka SQL Commands):

I used a few key SQL commands that acted like my trusty tools:

  • SELECT: To pick the specific information I wanted (like ride counts or weather conditions).
  • WHERE: To filter the data and focus on specific criteria (like rides on Saturdays).
  • GROUP BY: To organize the data into categories (like by company name).
  • ORDER BY: To sort the results (like from most rides to least).

Click the image to see all of the queries

Why This Matters (Beyond Just Numbers):

This project wasn't just about crunching numbers. It was about using data to tell a story. By analyzing the data, we could understand:

  • Customer Preferences: Which taxi companies are the most popular? When do people tend to travel?
  • External Influences: How does the weather affect travel time?
  • Competitive Landscape: How are different companies performing relative to each other?

Want to Learn More?

If you’re curious about SQL or data analysis, I’ve got some resources for you:

I hope this gives you a fun and insightful peek into my data adventure!


March 2025

NYC Transportation

Descriptive and Diagnostic Analysis

This project was an analysis of the NYC school transportation system using Microsoft Excel to clean data, create pivot tables and charts, and generate insights on delays and breakdowns.

Excel Data Cleaning Data Visualization Reporting

December 2024

US Debt Tracker

US Public Debt Analysis

This project was an analysis of historical US public and intragovernmental debt to identify trends, forecast future growth, and provide insights via Microsoft Excel.

Excel Data Visualization Forecasting Reporting

August 2024

Manhattan Vacation Rental Market

Market Analysis

A consult for a short-term rental company on what types of properties they should be targeting based on Airbnb listings and to present the findings via Google Spreadsheets.

Google Sheets Data Visualization Market Analysis Reporting

May 2024

Fresh Beats

Status Report

The project task was to present business recommendations based on a spreadsheet analysis done by senior members of the team; completed via Word Report.

Google Sheets Market Analysis Reporting Stakeholder Presentation

November 2023

E-Commerce Company

e-Commerce Analysis

The project task was to analyze raw transaction logs for an e-commerce company and present analytical business findings via Google Spreadsheets.

Google Sheets Data Cleaning Market Analysis Reporting

October 2023

Zuber

Demand Analysis

A consult for the rideshare company Zuber to understand passenger preferences and the impact of external factors on rides using an SQL database.

SQL Data Visualization ETL Market Analysis