Animation Movies
A Post-Bootcamp Competition Story
How a 4-day data competition bridged the gap between theory and practice.
Shortly after finishing my data analytics bootcamp last year, I dove headfirst into one of my first real challenges: a 4-day, team-based data visualization competition hosted by TripleTen using data from Kaggle. The setup was simple but intense.
Our team of three was given five datasets and one open-ended prompt: find a compelling story and prepare to present it live on YouTube. We immediately had a hunch that the Spotify dataset would be the most popular choice. To stand out, we made a strategic decision to go against the grain. We chose a dataset that sparked our creativity: 80 years of animated movies. This project was the ultimate test of our new skills, forcing us to quickly move from raw data to a polished, public-facing presentation. It was a high-speed crash course in the real-world workflow of a BI team.
From Brainstorm:
With the clock ticking, our team’s first task was to define our project. We brainstormed questions a studio executive might ask to gain a competitive edge. We focused on three core questions to guide our analysis:
- Which studios have truly dominated the animation industry over the years?
- How has the very nature of these films (like runtime) evolved?
- Does a bigger budget actually guarantee a better audience rating?
From Python:
Our workflow was a perfect simulation of how a modern data team operates, blending different skills to achieve a single goal.
- Collaborative Data Cleaning: Our team's first hurdle was the data itself. One of my teammates handled the initial prep using Python to efficiently wrangle the messy dataset, creating a pristine file for us to work with.
- Visualization and Storytelling in Tableau: With the clean data ready, we imported it into Tableau, which became our command center. This is where my BI skills came to life. I focused on building the core visualizations like bar charts, line graphs, and scatter plots that would form the foundation of our narrative.
- Building the Narrative in a Story: We arranged our finished visualizations into cohesive dashboards. Then, using Tableau's Story feature, we sequenced our dashboards into a step-by-step narrative that would walk our audience and the judges through our discovery process.
The Discoveries:
Our Tableau dashboard revealed several clear and impactful insights that became the centerpiece of our live presentation.
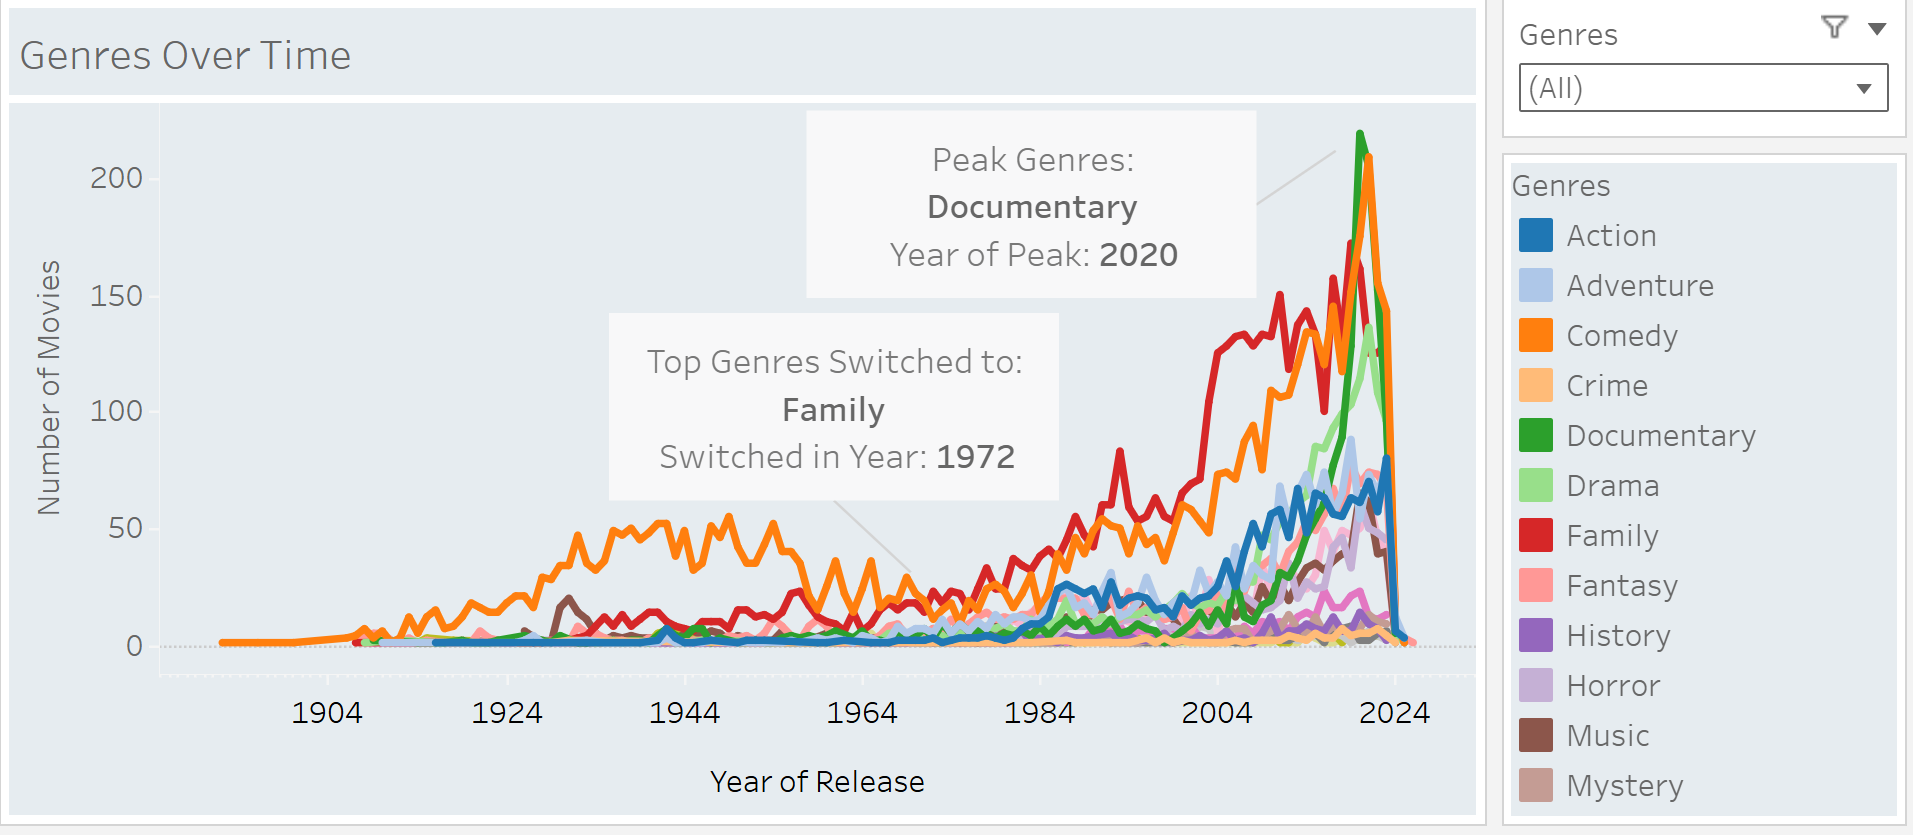
Insight 1: A Genre Showdown Through the Decades
Our analysis of genre trends revealed a fascinating shift in audience taste over time. We created a line chart tracking the most produced genres for each decade, which clearly showed that Comedy was the undisputed king of animation until the 1970s. From that point on, Family films took over as the dominant genre. Our data also captured a surprising anomaly: a brief but sharp spike in Documentaries right at the beginning of the pandemic, reflecting a unique moment in viewing history.
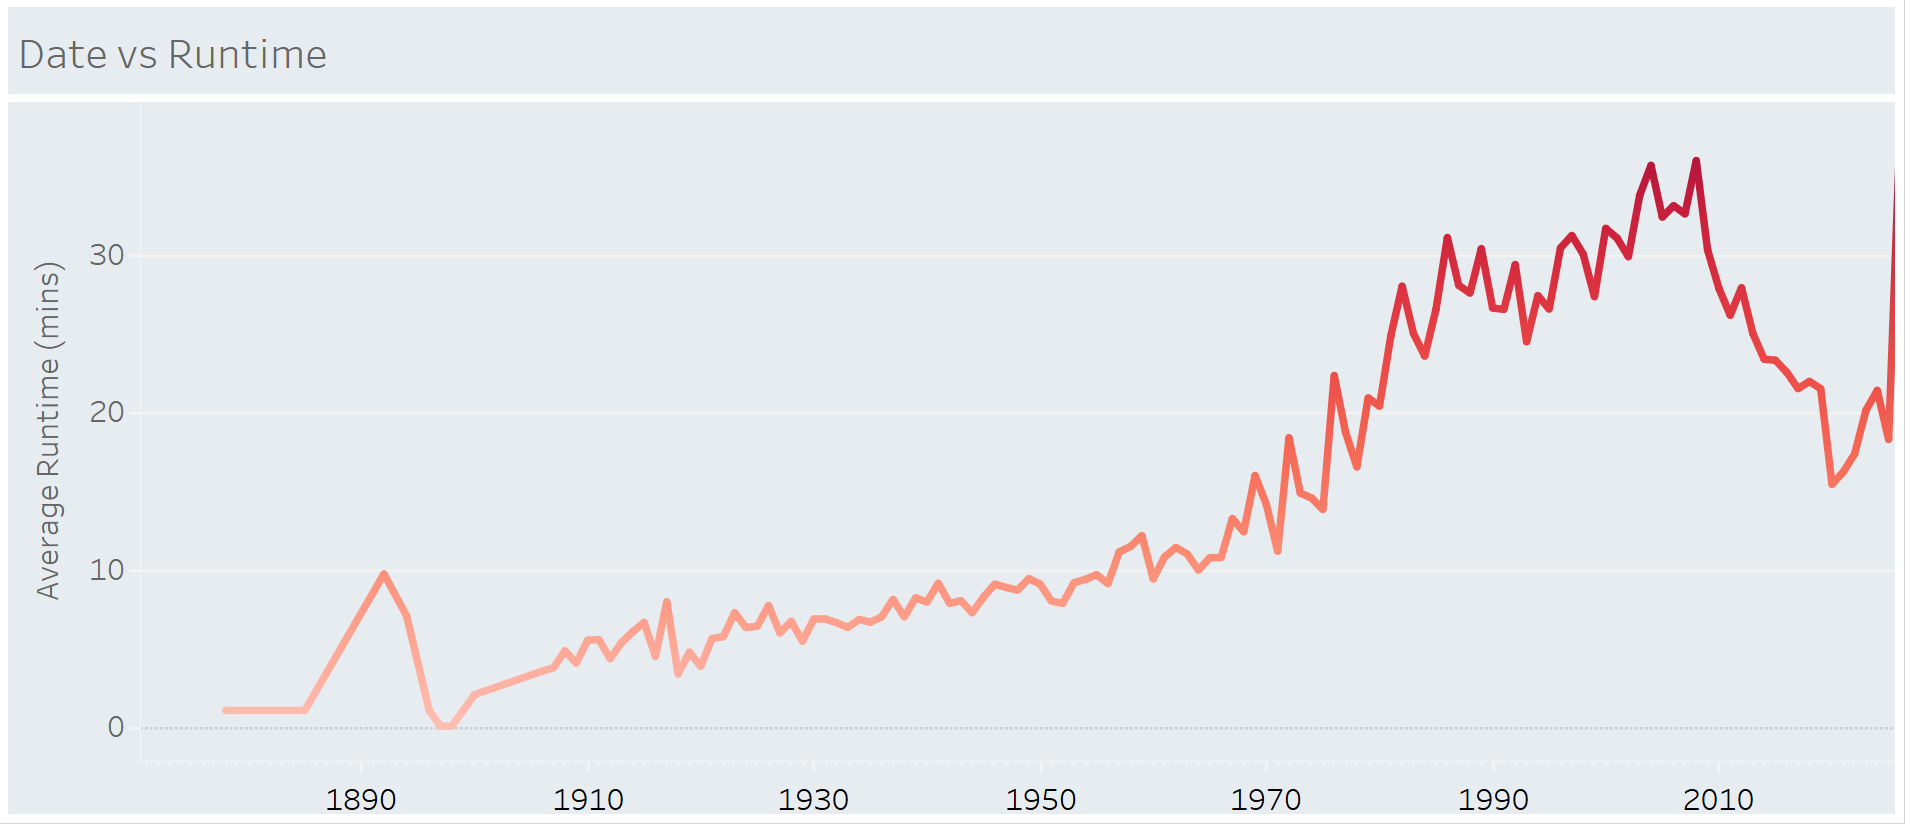
Insight 2: We're Watching Longer Movies
A line chart tracking the average runtime of animated films per decade revealed a distinct upward trend, showing how storytelling and audience expectations have evolved from the 75-minute features of the 1940s to the 100+ minute epics of today.
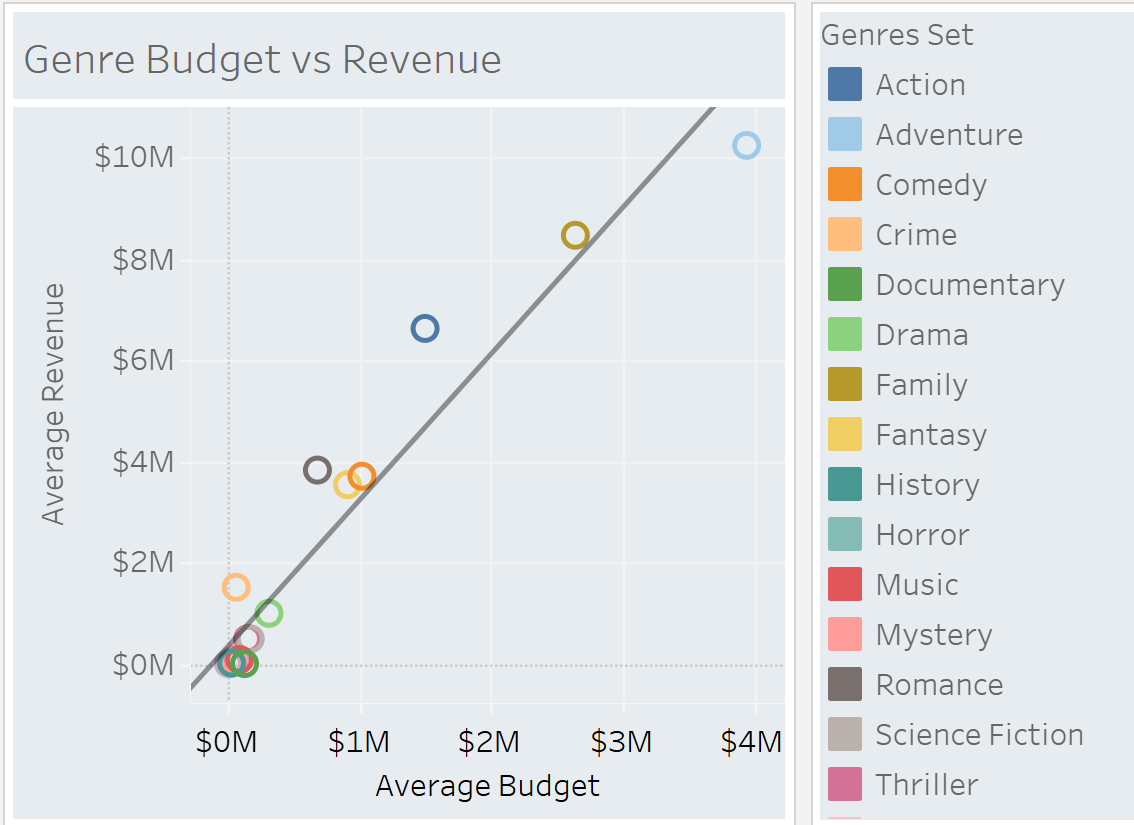
Insight 3: Bigger Budgets, Bigger Box Office
Our final Tableau scatter plot mapped production budgets against total revenue and delivered a critical business insight: there was a strong positive correlation. This visual was key in our presentation. It demonstrated that, generally, as a studio's investment in a film increases, so does the potential for higher box office revenue. For an executive, this reinforces the strategy that larger investments in tentpole animated features are a sound financial bet.
To Infinity!:
Presenting our Tableau story live on YouTube was a nerve-wracking but incredibly rewarding experience. This competition, coming so soon after my bootcamp, was a crucial bridge between theory and practice.
It taught me the vital rhythm of a BI project: taking the clean data from an analyst, diving deep into it with a tool like Tableau, and emerging with a clear, compelling story that can inform and persuade an audience.
It solidified that this is exactly where my skills shine. My psychology background pushes me to find the 'why' in the data, and my BI training allows me to build the story that delivers the answer.
Ready to see the work behind the story?
GitHub Portfolio YouTube RecordingResources for Your Career Journey:
My foundation in data analytics came from the Business Intelligence Analyst bootcamp at TripleTen. If you're looking to acquire the in-demand skills needed for a career in tech, check out their program. You can use my Referral Link for more information.