The Zuber Database
Using SQL to Analyze Taxi Rides in Chicago
My SQL Adventure with the Zuber Database:
Ever wondered what makes a taxi driver's day? Is it a sunny Saturday or a rainy Tuesday? Which company reigns supreme in the Windy City? As part of my Business Intelligence Analytics training with TripleTen, I dove headfirst into a project that aimed to answer these very questions, using the magical powers of SQL!
Think of SQL as the secret language you use to chat with databases. It's how you ask them questions and get them to spill their secrets. In this case, our database was a treasure trove of Chicago taxi ride data – think of it as a digital diary of every trip, from pickup to drop-off.
Why did I embark on this data quest?
Imagine you're running a ride-sharing app. Wouldn't it be awesome to know what customers want, what affects their travel plans, and how your competitors are doing? That's exactly what this project was about! By digging into the data, we could uncover hidden patterns and trends that could help companies like Uber or Lyft make smarter decisions.
My Mission:
- Part 1: The Great Taxi Census: I used SQL to count taxi rides for different companies during specific periods. It was like conducting a census, but for taxis! I wanted to know who was the most popular kid on the block. By grouping and sorting the data, I could easily see which companies were racking up the rides. It was a bit like a taxi popularity contest!
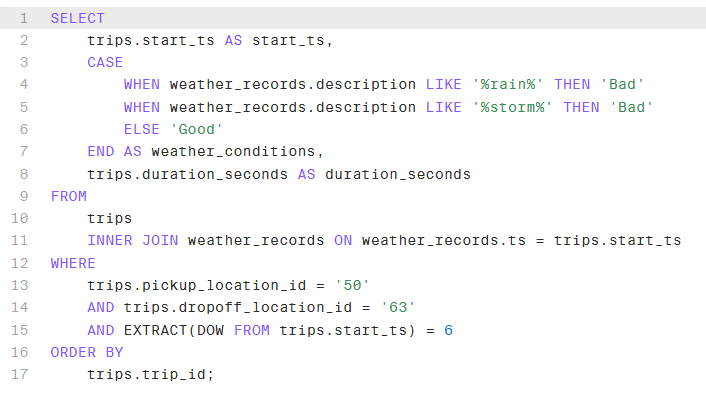
- Part 2: Loop to O'Hare - The Weather Challenge: This part was all about figuring out if Mother Nature had a say in how long it took to get from the Loop to O'Hare. I played detective, finding the neighborhood IDs for these locations and then checking the weather records for each hour. I even created a simple weather rating system: "Good" for no rain or storms and "Bad" for those less-than-ideal conditions. Then, I pulled up all the Saturday rides between these two points, noting the weather and the ride duration. This allowed me to see if a rainy Saturday meant a longer trip to the airport.
The Tools of the Trade (aka SQL Commands):
I used a few key SQL commands that acted like my trusty tools:
- SELECT: To pick the specific information I wanted (like ride counts or weather conditions).
- WHERE: To filter the data and focus on specific criteria (like rides on Saturdays).
- GROUP BY: To organize the data into categories (like by company name).
- ORDER BY: To sort the results (like from most rides to least).
Why This Matters (Beyond Just Numbers):
This project wasn't just about crunching numbers. It was about using data to tell a story. By analyzing the data, we could understand:
- Customer Preferences: Which taxi companies are the most popular? When do people tend to travel?
- External Influences: How does the weather affect travel time?
- Competitive Landscape: How are different companies performing relative to each other?
Want to Learn More?
If you’re curious about SQL or data analysis, I’ve got some resources for you:
- TripleTen: An online coding bootcamp that enables people with busy lives to make the transition into tech. My Discount Link
- W3Schools: Self directed learning
- Khan Academy: Self directed learning
I hope this gives you a fun and insightful peek into my data adventure!