My Data Journey

How a global pandemic and a passion for data led to a new career.


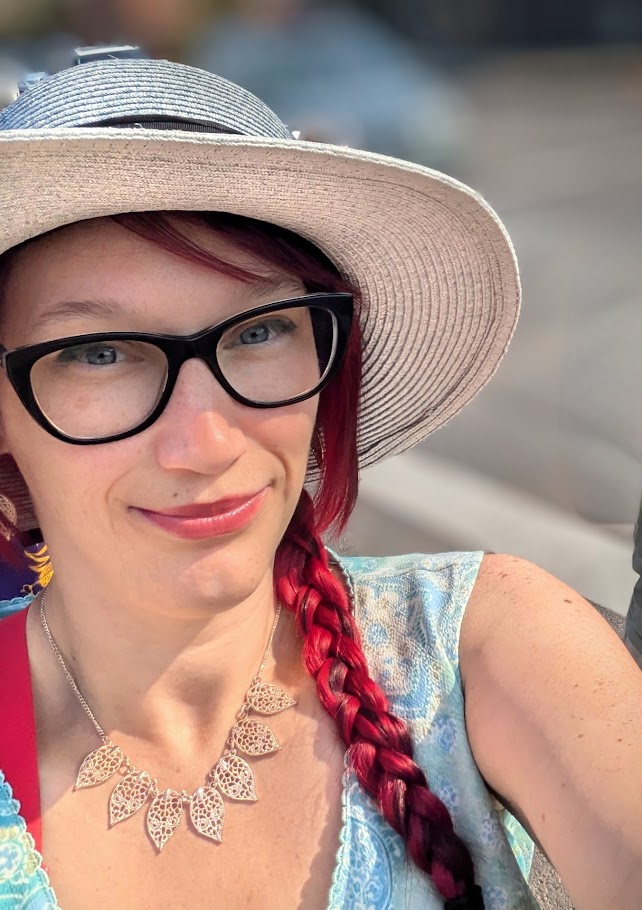
Let me introduce myself properly

Hi there! I'm Tiffany. Beyond the world of data, I'm a mom to two wonderful kids, a friend to many, and a partner to one amazing person. They're my 'why' and a constant reminder of the human side of everything we do.


A Career Reimagined

In 2020, the global pandemic brought my previous career to an unexpected halt. Like many, I was laid off and found myself at a crossroads. That moment of uncertainty became a silver lining—an opportunity to reflect, redefine my path, and build something new.

My Bachelor of Arts in Psychology, earned long before my career transition, taught me to be relentlessly curious about human behavior. It trained me to ask "why"—to look beyond the surface and understand the motivations behind actions.

I decided to pivot into data analytics. I discovered it was the perfect toolkit to find the answers. It allows me to apply the same principles of inquiry and discovery from psychology.

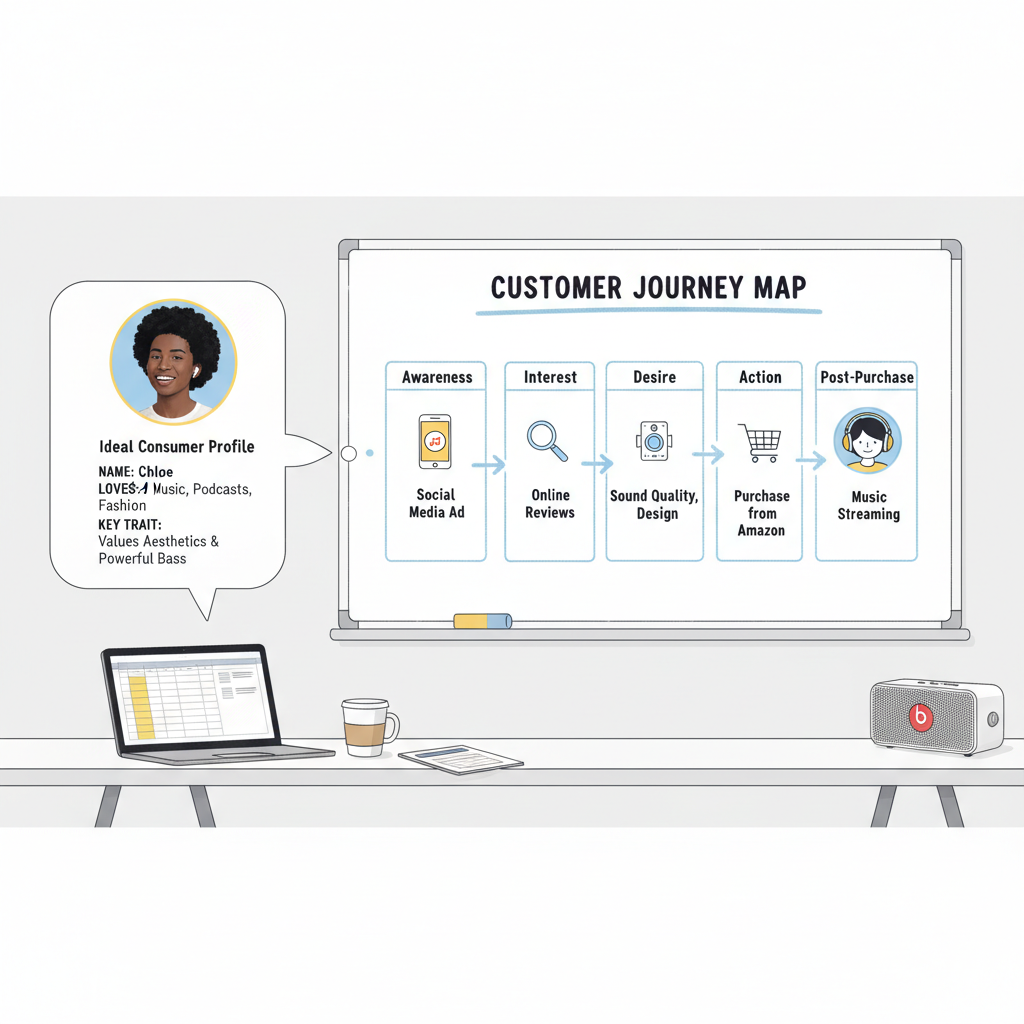
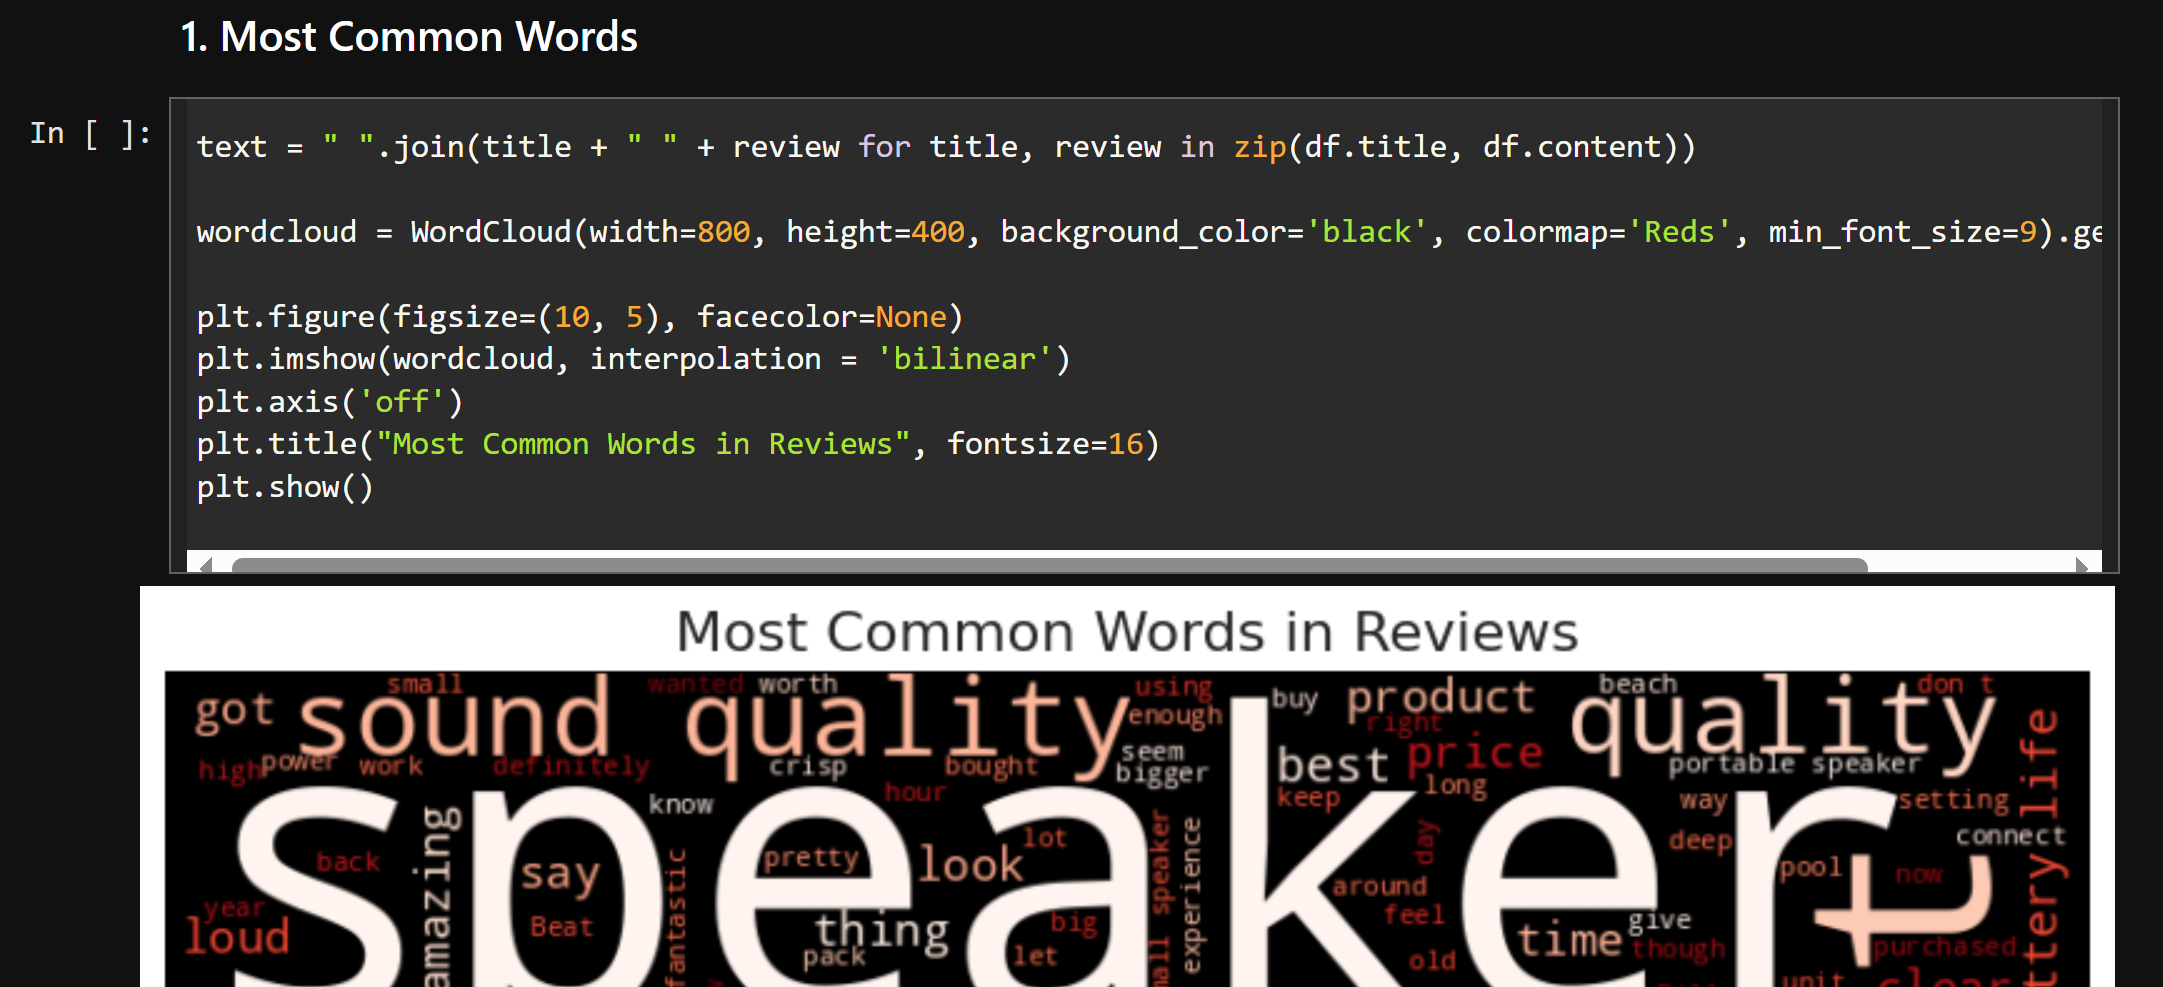
With this clear vision, I took action. I enrolled in a rigorous business intelligence bootcamp to master the technical toolset, including SQL, Tableau, and Power BI. It was there that I discovered my true passion: transforming raw data into the compelling visual stories that empower businesses to make smarter decisions.

Since then, I've learned Python, about AI, and participated in externships. To continue building on that momentum, I am now pursuing a Master of Science in Information Technology. This advanced degree is deepening my expertise in the systems and strategies that power modern businesses, ensuring I can solve not just today's challenges, but help manage tomorrow's as well.

Driven by a Desire to Help

My journey isn't just about changing jobs; it's about aligning my work with my core values. I'm driven by a strong desire to make a positive impact on the lives of others. I've dedicated time to various volunteer roles, including supporting hospice patients, mentoring students, and assisting with community health initiatives. These experiences have not only enriched my life but also instilled in me the value of empathy, compassion, and teamwork. I believe these qualities are essential for fostering positive relationships and contributing to a supportive and collaborative work environment. I bring that same sense of empathy to every dataset I analyze and every team I work with.

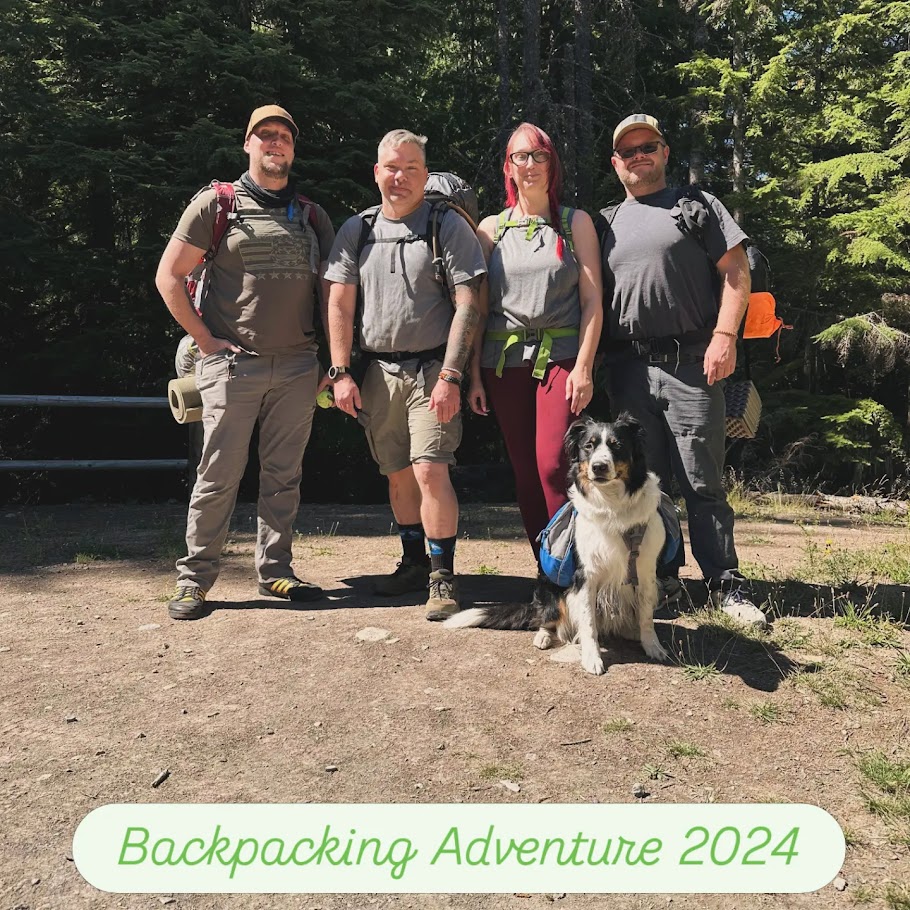
When I'm Not at the Keyboard

When I step away from the data, you can usually find me enjoying outdoor adventures, getting lost in a good book, diving into video games, or working on a new craft project. These hobbies help me stay creative, curious, and balanced.

Beats by Dre

Business Intelligence Analysis

From Catch-22 to a Master in Tech

The Catch-22 of the job market is all too familiar: you need experience to get a job, but you need a job to get experience. After a challenging search for an entry-level role, I found my way to Extern.com, a platform that promised to solve this very problem. What followed was a project that not only gave me a portfolio piece but also changed my career trajectory and cemented my love for tech.

This is the story of my Externship with a major tech company, working on a project with a strong focus on Market & Competitor Analysis for Beats by Dre.

Decoding the Wireless Speaker Market

My project began with a core business challenge: "What are the key factors driving consumer interest in high-fidelity wireless speakers, and how do evolving preferences influence this market?"

This wasn't just a theoretical exercise. It was a real-world problem for a global brand, and it was my job to find the answers. To tackle this, I needed to go beyond what I learned in my boot camp and dive into new skills and tools.

My Methodical Approach

This project was a true test of my skills, taking me from the foundational stages to a final, strategic deliverable.

  1. Foundational Research & Planning
  2. I started by getting into the mind of the customer. I used frameworks like AIDA (Attention, Interest, Desire, Action) to create a customer journey map and an ideal consumer profile. This step was crucial for ensuring that my analysis would be human-centric and focused on a real business problem.

  3. Data Acquisition & Analysis

    With the groundwork laid, I dived into the data. I used Python to scrape and clean a massive dataset of nearly 5,000 Survey responses and Amazon reviews for key Beats by Dre competitors like JBL, Bose, Sony, and Marshall. This was my first time working with messy, real-world data, and I leveraged libraries like Pandas & Numpy to prepare it for analysis.

    I then moved on to Exploratory Data Analysis (EDA), using Matplotlib and Seaborn to visualize trends. I analyzed review lengths, ratings, and common keywords to find initial patterns.

  4. Advanced Insights with AI

    The most exciting part of this project was applying advanced techniques and modern tools to gain a deeper understanding of the data. To get started, I imported a full suite of Python libraries for my analysis, including:

    • nltk (Natural Language Toolkit): A powerful platform for working with human language data, which was essential for preparing the text for analysis.
    • textblob: A library for performing sentiment analysis and other natural language processing (NLP) tasks.
    • wordcloud: To visually represent the most common words in customer reviews.
    • google.generativeai (Gemini API): An advanced AI tool used to perform qualitative analysis and summarize key takeaways from the sentiment analysis.

    I also leveraged AI tools like Gamma & Claude for a presentation slide-deck and dashboard creation. This felt like the "next tier" of learning, as I explored advanced prompting techniques to find hidden insights in open-ended survey responses and build a dynamic dashboard.

Actionable Insights for a Global Brand

The result of my work was a comprehensive analysis that led to clear, actionable recommendations. I delivered a presentation and an AI-driven dashboard that provided a data-backed roadmap for the company's product strategy.

Here are a few key findings from the analysis:

  • Premium is Profitable: My analysis found that 20% of users were willing to pay over $200 for superior audio quality.
  • Targeted Demographics: I identified that Gen Z prioritizes clarity, powerful bass, and loudness, while Millennials value balanced sound and brand reputation.
  • The Path Forward: My recommendations included focusing product development on superior sound and design, a digital-first marketing strategy, and competitive pricing to secure market leadership.

This project was a powerful reminder that data analysis is not just about numbers, but about telling a compelling story that solves a business problem.

The Career Pivot to a Tech Passion

This externship was a pivotal moment in my career pivot. It transformed my love for data into a love for tech, demonstrating how the right tools and a structured approach can bridge the gap between education and real-world application. The skills I gained are invaluable.

My success in this project was the final confirmation I needed to take the next step: enrolling in a Master of Science in Information Technology program. I am excited to continue building on this foundation and applying my unique blend of business acumen and technical skills to new challenges.

For a deeper dive into this project and to see my work, explore these links:

  • My GitHub Portfolio: Visit my GitHub repository for this project HERE
  • Final Presentation: See the full presentation delivered to stakeholders HERE
  • AI-Driven Dashboard: Explore the dynamic dashboard I created HERE

Resources for Your Career Journey

If you're looking to break the "Catch-22" and gain real-world experience, I highly recommend exploring externships and professional development platforms.

  • Externships: I am living proof that externships with Extern.com can provide the experience you need. They give you an opportunity to work on real-world projects with leading companies and build a portfolio that stands out.
  • Bootcamps: My foundation in data analytics came from the Business Intelligence Analyst bootcamp at TripleTen. If you're looking to acquire the in-demand skills needed for a career in tech, check out their program. You can use my referral link My Discount Link for more information.

CrewTracker Software Project

Migration and Merged Reports

From Legacy Reports to Interactive Dashboards

Data tells a story, but sometimes that story gets lost in translation. During my first foray into the professional world as a BI Analyst, I had the opportunity to help a company, CrewTracker Software, rewrite their data narrative. They were wrestling with a common problem: an outdated reporting system that hindered their clients' ability to understand and act on critical information. My team and I tackled this by migrating over 170 Crystal Reports to modern, interactive Power BI dashboards. This experience not only solidified my BI skills but also highlighted the transformative power of effective data visualization.

The Crystal Reports Conundrum

CrewTracker Software provides solutions for managing field service operations. Like many established companies, they relied heavily on Crystal Reports, a legacy reporting tool. While functional, Crystal Reports can be cumbersome, especially for complex data analysis and interactive exploration. Imagine trying to piece together a dynamic, 360-degree view of your business from static, printed reports – that's the challenge CrewTracker's clients faced.

Our mission was clear - modernize CrewTracker's reporting system by converting these static reports into dynamic, user-friendly Power BI dashboards. This would empower their clients to:

  • Effortlessly explore their data.
  • Identify trends and patterns.
  • Make data-driven decisions with confidence.

A Three-Pronged Approach to Transformation

To efficiently tackle this large-scale migration, we adopted a three-tiered approach:

  1. First Responders: Extracting the Blueprint
    • 5 of our 20 externs had the first task - to dissect the existing Crystal Reports and document their key elements. This step was crucial "reverse engineering," laying the groundwork for accurate replication in Power BI. This involved:
      • Connecting to the CrewTracker workstation via Remote Desktop Connection.
      • Capturing screenshots of the report layout and field details.
      • Exporting PDF views of the reports.
      • Most importantly, extracting the underlying SQL queries and formula fields.
    • As a First Responder, I personally cataloged 91 Crystal Reports.
  2. Power BI Team: Building the Interactive Future
    • All 20 externs joined the Power BI team. We were responsible for the core conversion and modernization work:
      • Translating the extracted SQL queries and formulas into Power BI.
      • Designing interactive dashboards that went beyond the limitations of the original static reports.
      • Creating merged reports, where appropriate, to consolidate information and provide a more holistic view.
    • I successfully converted 3 Crystal Reports into a complex and interactive merged Power BI dashboard.
  3. Peer Reviewers: Ensuring Accuracy and Quality
    • To maintain quality, each Power BI report underwent rigorous peer review. This involved:
      • Verifying the accurate replication of the original report's layout and functionality.
      • Confirming the accuracy of the SQL queries.
      • Ensuring that all Crystal Report formula fields were correctly translated into Power BI DAX measures and calculated columns.
      • Assessing the overall completeness and purpose of the converted report.
    • I contributed to this stage by peer-reviewing 9 Power BI reports, ensuring they met the high standards of accuracy and usability.

Diving Deeper: The Call List Merge Report

One of the most challenging and rewarding tasks was creating a merged Power BI dashboard for the "Call List" reports. This involved:

  • Consolidating SQL queries from three separate Crystal Reports into a single, optimized SQL Direct Query within Power BI.
  • Designing a dashboard that accurately reflected the layout expectations of the original reports while leveraging Power BI's interactivity. This required careful consideration of how to best represent the data and enable user exploration.
  • Translating complex Crystal Report formula fields into Power BI DAX measures and calculated columns. This was a critical step, as DAX provides powerful analytical capabilities but requires a different syntax and approach than Crystal Reports formulas. I had to ensure that the formatting of these DAX calculations allowed for flexibility and future use.

*Please note, a Dummy Server was used for the purposes of this example to preserve CrewTracker's confidential data*

Key Insights

This project yielded significant insights into the power of modern BI tools:

  • Enhanced Data Accessibility: Power BI dashboards provide a more intuitive and interactive way for users to explore data compared to static Crystal Reports.
  • Improved Data Visualization: Interactive dashboards allow for dynamic filtering, drilling down into details, and visualizing trends, leading to better understanding and faster decision-making.
  • Increased Efficiency: By consolidating reports and automating data refreshes, Power BI can streamline reporting processes and save time.

Results: Empowering CrewTracker's Clients

By modernizing its reporting system, CrewTracker Software is now better equipped to serve its clients. The transition to Power BI enables:

  • Deeper Data Insights: Clients can now uncover hidden patterns and trends in their data, leading to more informed business strategies.
  • Improved Decision-Making: Interactive dashboards provide the right information at the right time, empowering clients to make quicker and more effective decisions.
  • Increased Client Satisfaction: A user-friendly and insightful reporting system enhances the overall client experience.

A Foundation for Growth

This externship was an invaluable experience, providing me with hands-on experience in a real-world BI project. I honed my skills in:

  • Data extraction and analysis.
  • Report design and development.
  • Data visualization and dashboard creation.
  • SQL and DAX.
  • Teamwork and collaboration.

This project provided a strong foundation for my career as a BI Analyst, and I'm eager to leverage these skills to help other organizations unlock the power of their data.

Want to Learn More?

If you’re curious about Power BI or SQL, I’ve got some resources for you:

I hope this gives you a fun and insightful peek into my data adventure!


Past Projects


April 2025

Beats by Dre

Business Intelligence Analysis

An end-to-end data analysis using Python with several libraries and various AI to perform qualitative, quantitative, and sentiment analysis, and market & competitor research for a real-world product for Beats by Dre with Extern.

Python ETL Sentiment Analysis Web Scraping

September 2024

Puget Sound Water Quality

Environmental Analysis

This project was a Code Jam Competition. It was a light-hearted team project to create a visually compelling story from a provided dataset in 4 days to showcase collaboration skills via Tableau.

Tableau Dashboarding Data Visualization Stakeholder Presentation